EMA + Supertrendimage
EMA + Supertrend
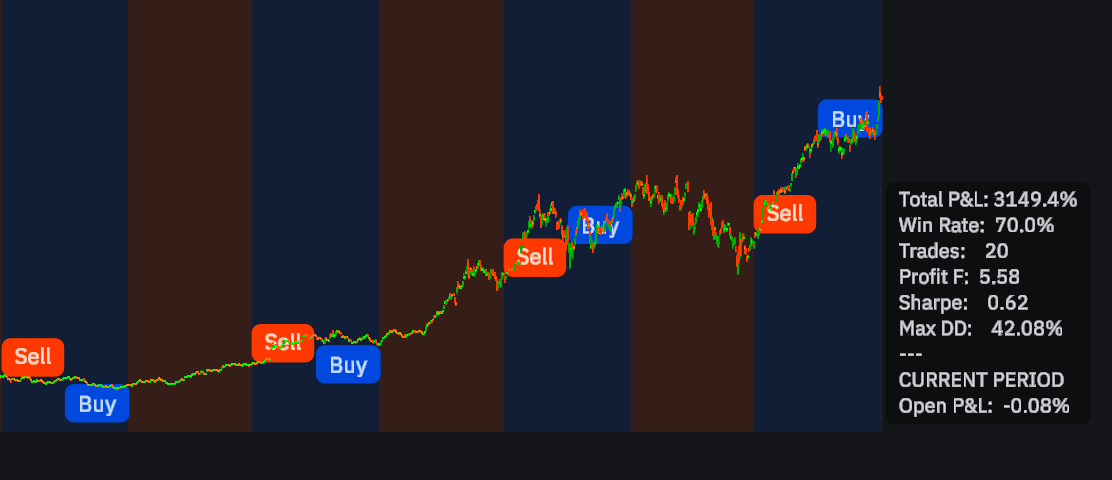
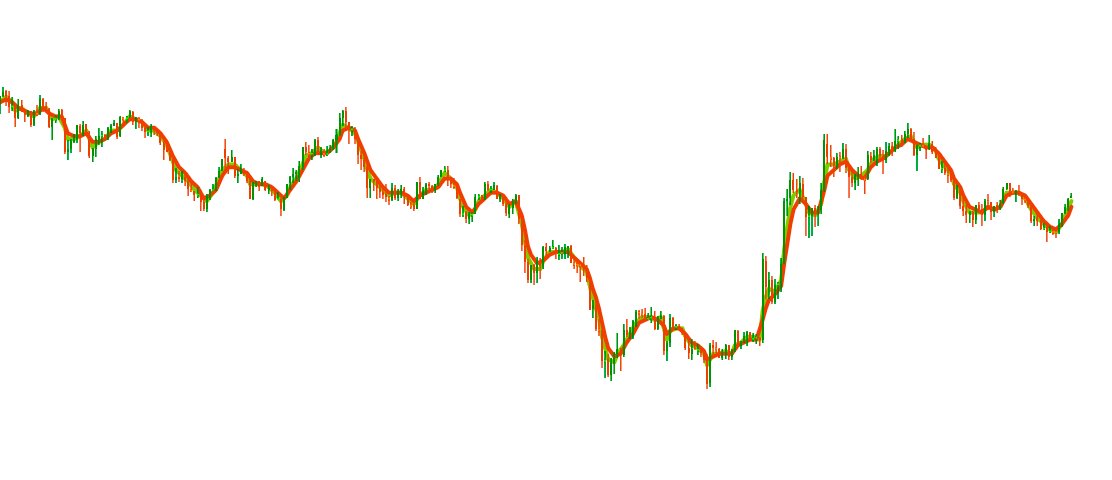
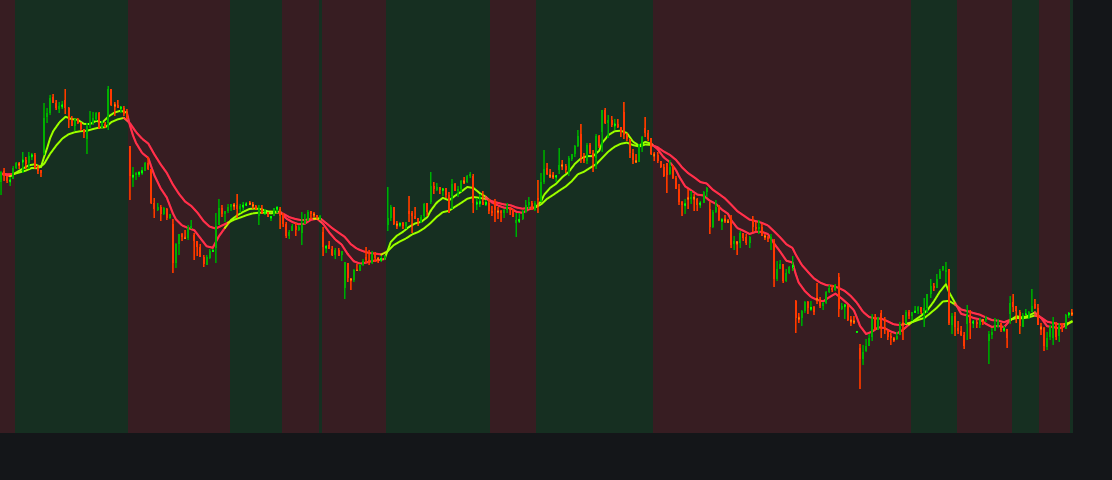
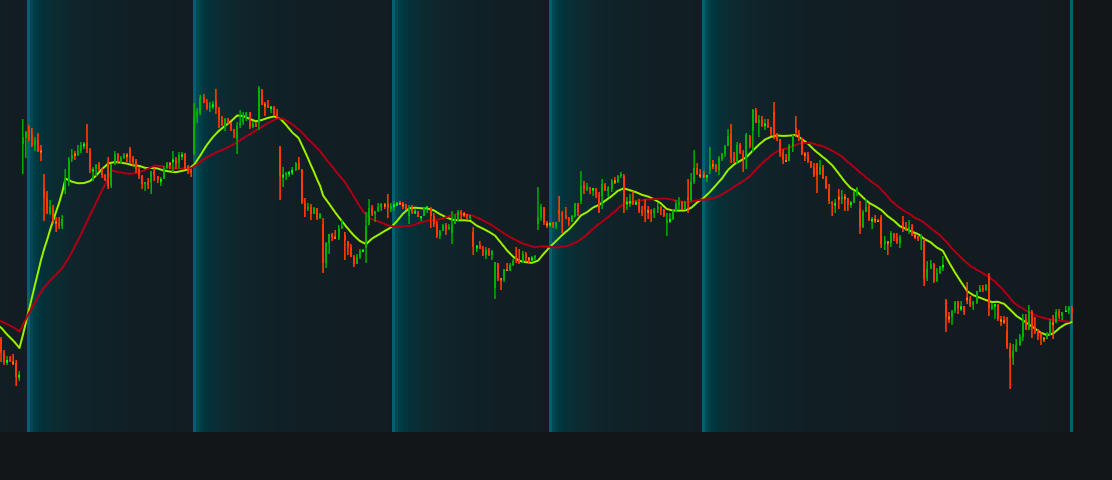
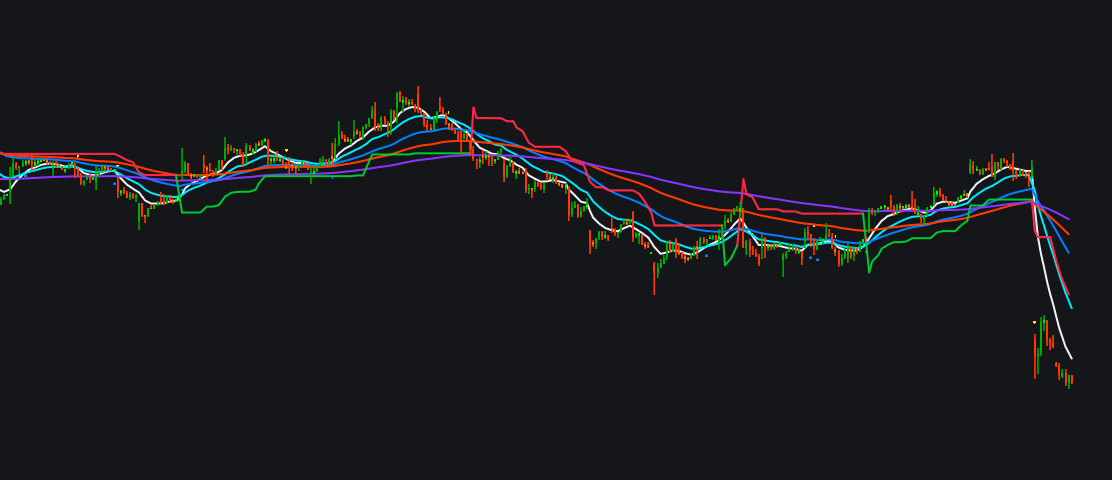
A clean trend overlay that combines five EMAs (9/21/50/100/200) with a color-switched Supertrend and simple BUY/SELL labels from the EMA-9 × EMA-21 crossover. It’s built to show structure (EMAs), direction (Supertrend), and timing (crossovers) without cl…
/indicator/ema-supertrend-7
Halloween Strategy 🎃image
Halloween Strategy 🎃
Indie indicator that visualizes the Halloween Effect end-to-start: it shades Oct 31→May 1 as the in-season window, auto-places Buy on Oct 31 and Sell on May 1, and renders a compact performance panel versus buy-and-hold with key stats (total P&L, win rat…
/indicator/halloween-strategy-74
Breakout Linesimage
Breakout Lines
Breakout Lines by XEB06 ! This isn't any magical Indicator or the Holy Grail. This is a simple indicator based on the EMA 3 and 5. Calculated on HLC while ignoring Open price for smoothing the price. Generally works on Stocks, Indices, Metals, BTC and ET…
/indicator/breakout-lines-11
9 & 21 EMA Crossover with Backgroundimage
9 & 21 EMA Crossover with Background
EMA 9/21 Crossover – Dynamic Trend Visualizer Unlock trend signals with this EMA crossover indicator! It overlays 9-period (fast) and 21-period (slow) Exponential Moving Averages, and kicks your chart into high gear with color-coded lines and auto-adjust…
/indicator/9-21-ema-crossover-with-background-81
Highlight Crossover - Background Color Exampleimage
Highlight Crossover - Background Color Example
This educational indicator demonstrates how to use the  @plot.background()  decorator in Indie to visually highlight important market events. The indicator tracks crossovers between 15 and 30-period SMAs. When the fast SMA crosses above the slow SMA, it …
/indicator/highlight-crossover-background-color-example-76
ICT Concepts: FVG, Liquidity, BOS, MSS by Bigshotimage
ICT Concepts: FVG, Liquidity, BOS, MSS by Bigshot
What This Indicator Does This comprehensive tool combines four essential ICT concepts into one powerful indicator: 🟢 Fair Value Gaps (FVG)  - Automatically detects and displays bullish and bearish imbalance zones where price is likely to return. These a…
/indicator/ict-concepts-fvg-liquidity-bos-mss-by-bigshot-81